📈 Golang profiling made easy

Overview
Profiling golang program enables us to gain insights of the inner workings of golang application and allows us identify performance bottle-neck. The built-in golang tool pprof supports three types of profiling: CPU, Memory, and Trace. CPU profiling reveals the time consumed across various code paths, making identifying performance hotspots easier. Memory profiling provides information on memory allocation patterns. While trace profiling offers a complete and dynamic view of statistics of CPU, memory, goroutines over the life-cycle of the program being profiled.
Applying the three profiling tools follows a general procedure which consists of following major steps:
- Instrument the main function
- Build instrumented program
- Run instrumented executable
- Analyse and visualising profiling results
However, manually applying this procedure is error-prone, this blog proposes a structured approach to conduct CPU/Memory/Trace profilings for any golang project, using the go-pprof-example (program that generates complex Mandelbrot fractal) as an example, which demonstrates how to insert profiling code, execute instrumented program, and visualise profiling results with a Makefile that orchestrates and automates the profiling tasks. This approach can be generalized and adapted to golang projects with varying complexity.
CPU profiling
Profiling CPU usage of a golang program requires instrumentation of the main function like:
// at the start of main.go, import this library
import "github.com/pkg/profile"

//...
func main() {
	defer profile.Start(profile.CPUProfile, profile.ProfilePath(".")).Stop()

    // ...
}
The Makefile the of go-pprof-example project includes a target named
prep-pprof-cpu to automate the instrumentation of profiling code and build
the corresponding binary. This target instruments the main function using a
Perl one-liner and the goimports CLI. The second target pprof-cpu launches
the instrumented program and collect profiling data. Additionally, the third
target pprof-viz-cpu launches a webserver and browser to display various
tables and diagrams. This target chains the previous two targets, therefore you
can invoke it to automate the entire CPU profiling process in one go like:
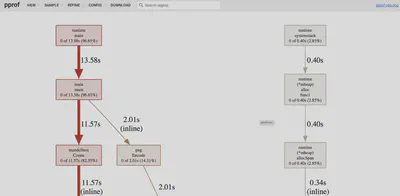
make pprof-viz-cpu
When the above command completes, you should see the callgraph being displayed in the browser like:
Memory profiling
Similar to CPU profiling, getting insights of memory usage of a golang program also needs instrumentation of the main function:
// at the start of main.go, import this library
import "github.com/pkg/profile"

//...
func main() {
	defer profile.Start(profile.MemProfile, profile.ProfilePath(".")).Stop()

    // ...
}
The Makefile of the go-pprof-example project also includes a target
named prep-pprof-mem to automate the instrumentation. You can experiment the
entire memory profiling process in one go like:
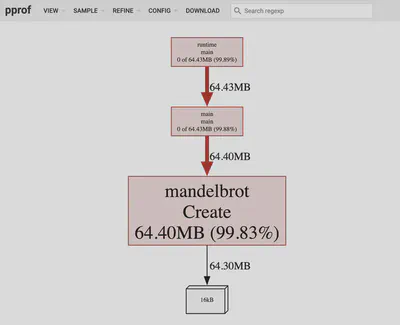
make pprof-viz-mem
When this command finishes, you should see the memory graph being displayed in the browser like:
Trace profiling
Similar to CPU and Memory profiling, the generating trace of a golang program is also mandatory to instrument the main function as follows:
// at the start of main.go, import this library
import "github.com/pkg/profile"

//...
func main() {
	defer profile.Start(profile.TraceProfile, profile.ProfilePath(".")).Stop()

    // ...
}
The Makefile of the go-pprof-example project also includes a target
named prep-pprof-trace to automate the instrumentation. You can experiment the
entire trace profiling process in one go like:
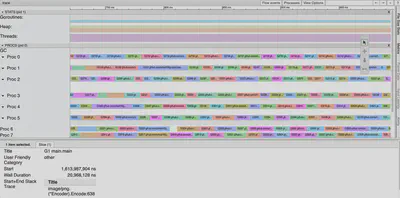
make pprof-viz-trace
When the previous command succeeds, you should see the trace being displayed in the browser like:
Conclusion
By encoding the knowledge of instrumentation, executing profiling and launching go pprof tool for visualisation and analysis in Makefile, we can share the skills to gain insights of golang application internals in a scalable and consistent way. The go-pprof-example project is a good starting point to automate golang profiling tasks on real-world projects.
Reference
The mandelbrot example is inspired by the presentation GopherCon 2019: Two Go Programs, Three Different Profiling Techniques - Dave Cheney. For complete information on how to use the web interface, please refer to the official document of go pprof tool.